How We Build Analytics and Reporting for Sioux Falls
We start by instrumenting what should already be measured. Most Sioux Falls businesses we audit are running on broken or partial tracking. Google Analytics 4 set up wrong. Conversion events firing on the wrong page. Phone calls untracked. Form submissions not pushed to the CRM. Offline closes never tied back to the channel that produced them. Inside the first thirty days we fix all of it. Real-time tracking goes in across the website, the phone system, the CRM, and any offline conversion source that matters.
Attribution comes next. We build a model fit to your sales cycle, not a generic last-click default. For a roofer with a two-week sales cycle the model is relatively simple. For a wealth manager with a six-month courtship and a multi-touch journey across LinkedIn, brand search, and a Forward Sioux Falls referral, the model is more layered. Either way, every channel gets credit for the role it actually plays, and budget decisions follow the math instead of intuition.
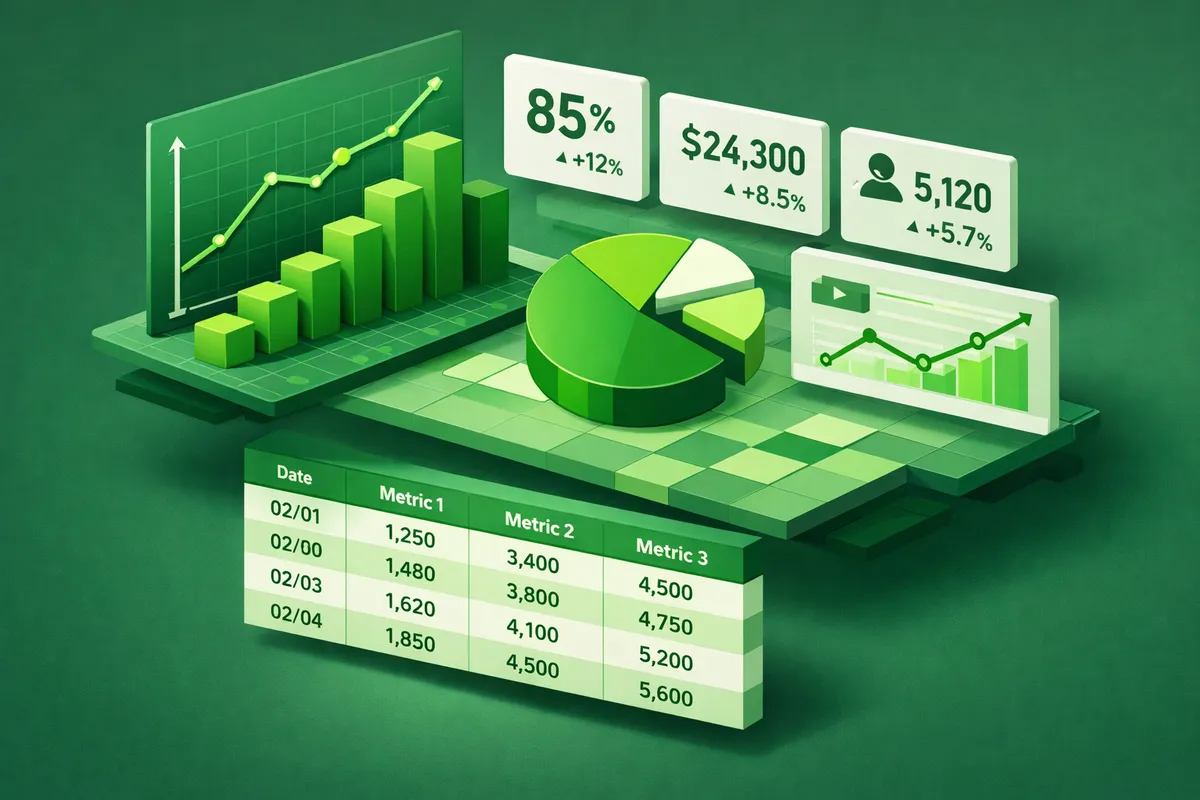
Dashboards replace the monthly PDF. We build live dashboards in Looker Studio, the platform we already use for clients, or whichever tool fits your stack, with the metrics owner-operators actually look at: leads by channel this week, cost per qualified lead, pipeline contribution, revenue attributable to marketing, and the construction-season pacing chart that tells you whether the spring is on track. The dashboards update in real time. The PDFs disappear.
Industries We Serve in Sioux Falls
Construction and Home Services. The category that benefits most from real-time reporting because the construction season is short and ad spend has to align with crew capacity inside the week. We build dashboards that track booked consultations by neighborhood, average ticket by service line, and pacing against the spring-through-fall revenue plan for operators across Brandon, Harrisburg, and the Empire Mall area customer base.
Real Estate. Realtors and brokerages where attribution is genuinely hard. Buyers from Iowa, Minnesota, and tax-climate moves touch many channels before signing a buyer agreement. We build the multi-touch model that shows which sources produce closed transactions, not just inquiries, across the suburb growth corridors of Brandon, Tea, Harrisburg, and Hartford.
Specialty Healthcare Practices. Dental, ortho, chiropractic, PT, dermatology, and similar practices along Western Avenue and 41st Street. The dashboard tracks new patient volume by source, lifetime value by channel, and the pacing metrics a practice manager actually uses, including chair utilization and recall efficiency.
Financial Services. Insurance brokers, wealth managers, accounting firms, and mortgage brokers in a market built on the credit card industry. The attribution model handles long sales cycles, multi-touch journeys, and the Forward Sioux Falls and Chamber referral flow that closes more business than any digital channel alone.
Senior Care. Assisted living, memory care, home care, and hospice operators where decisions cluster in Q4 and Q1 after holiday family visits. Reporting captures the full inquiry-to-move-in journey, including the months-long consideration window, so operators can see which channels actually produce occupancy versus which ones produce noise.
Manufacturing and Professional Services. B2B sellers reaching the 1,146 South Dakota manufacturers, plus law firms, accounting practices, and A and E firms. RFQ tracking, sales-cycle reporting, and account-based attribution for operators where one closed deal can equal a quarter of revenue.
What to Expect Working With Us
1. Tracking audit and instrumentation. Inside thirty days we fix every broken event, install proper call tracking, integrate the CRM with the website, and configure offline conversion uploads to Google and Meta where the sales cycle requires it. Most Sioux Falls operators discover during this phase that they have been operating with worse data than they thought.
2. Attribution model design. We build the model fit to your specific sales cycle, document it, and walk you through it so the team understands why a specific channel is getting more credit than the last-click report ever suggested. The model becomes the basis for every budget decision.
3. Live dashboards and reporting cadence. We build the dashboard, set the access permissions for owners, managers, and outside accountants where relevant, and establish the reporting cadence that fits your operating rhythm. Most operators move to a Monday morning fifteen-minute review instead of a delayed monthly meeting.
4. Continuous optimization. The reporting system informs every decision the marketing program makes from there forward. Channels that are not producing get cut. Channels that are producing get more budget. The owner sees it in real time and signs off on it inside the week.