How We Build Business Intelligence for Uptown
Our work starts with a data audit. We map every system your Uptown business uses, document what data each system generates, identify the data gaps and quality issues that exist, and interview your leadership about the decisions they currently make without sufficient information. This audit usually reveals more data than operators realize they have, along with the integration and quality work required to make that data usable.
We then design the right data architecture for your scale and situation. An Uptown venue might need a lightweight data warehouse in BigQuery or Snowflake that consolidates data from Ticketmaster or Eventbrite, the POS, merchandise systems, and accounting. An Argyle restaurant group might need a simpler consolidation that focuses on POS, delivery platform data, and financial performance. An Uptown nonprofit might need a data architecture that aggregates donor CRM, grant management, program tracking, and outcome measurement into a consolidated reporting view. The architecture matches your actual data volume, team capability, and budget rather than imposing enterprise patterns on neighborhood businesses.
ETL and data pipeline work is where most of the engineering happens. We build automated data flows that extract from source systems, apply cleaning and transformation logic, and load current data into the warehouse on refresh schedules appropriate to each source. For venue clients, ticketing data might refresh hourly during active event periods and daily otherwise. For restaurant clients, POS data refreshes multiple times per day while accounting data refreshes weekly. The refresh cadence matches business need rather than defaulting to arbitrary patterns.
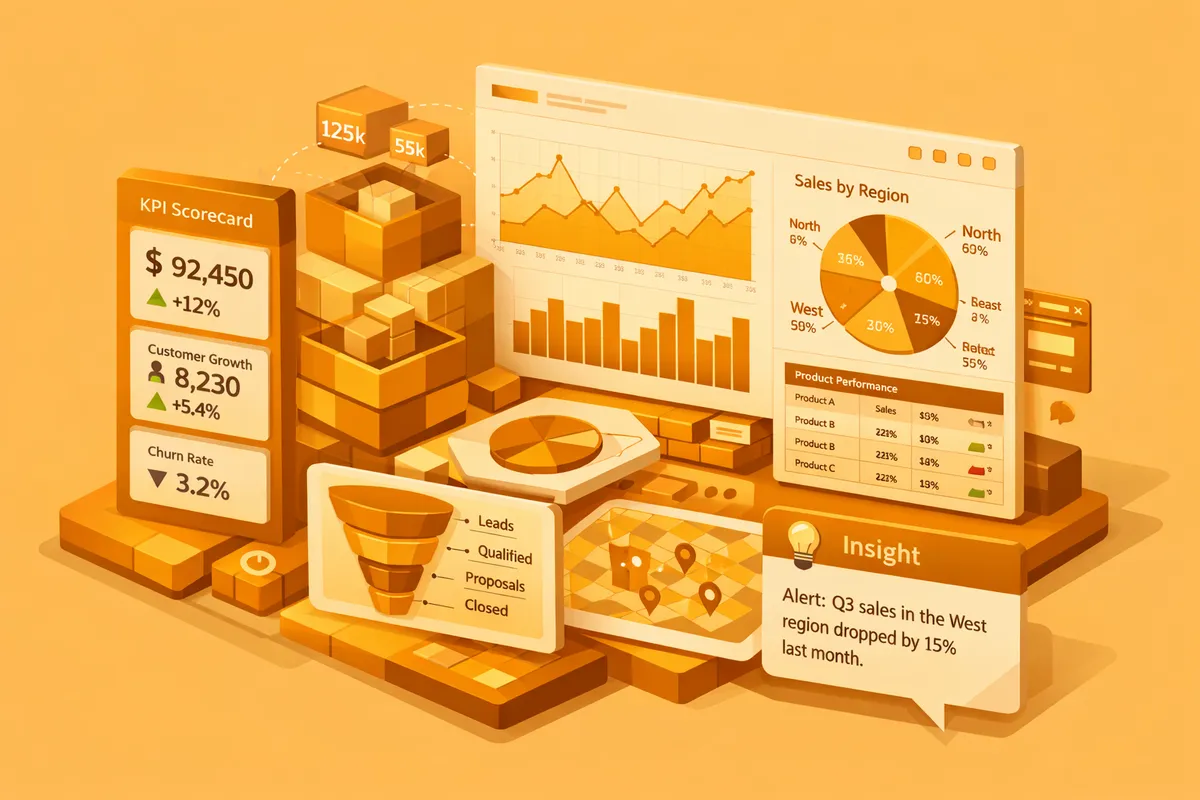
Dashboard design is where BI becomes usable rather than just buildable. We work with your leadership to identify the eight to twelve metrics that drive the most important decisions in your Uptown business. For a venue, that might be revenue per event by type, bar attach rate by event type, advance ticketing patterns, and profitability by day of week. For an Argyle restaurant, that might be revenue by channel, customer segment patterns, top-performing menu items by channel, and margin trends. For a nonprofit, that might be donor retention by cohort, program participation trends, grant-funded outcome metrics, and administrative cost ratios. Dashboards present these metrics with context, trend lines, and comparison periods that make current performance actionable.
Self-service analytics capabilities let your team explore data without requiring our involvement for every new question. Looker, Metabase, Power BI, or similar platforms give your leadership and operations team the ability to dig deeper when a dashboard surfaces something interesting, build custom views for specific decisions, and share insights across the team. Training is part of every deployment.
Industries We Serve in Uptown
Entertainment venues and music businesses at the Aragon Ballroom, the Riviera Theatre, the Green Mill, and the constellation of smaller venues near the entertainment anchors use BI to analyze booking performance, event profitability, customer retention, and operational efficiency across ticketing, bar, concessions, and private event revenue streams.
Restaurants and food businesses along Argyle Street, Broadway, and the Lawrence corridor use BI to connect POS data, delivery platform performance, customer patterns, and financial metrics into a consolidated operational view. Menu performance analysis, channel profitability comparison, and customer cohort analysis replace gut-feel decision making.
Community organizations and nonprofits rooted in Uptown use BI to connect donor management, program tracking, financial performance, and outcome measurement across platforms. Grant reporting gets easier, outcome communication becomes more credible, and leadership decisions get supported by integrated data.
Small professional services firms across Uptown's commercial corridors use BI to connect client acquisition data, matter or engagement performance, financial metrics, and marketing attribution. Practices see their actual economics clearly for the first time.
Retail and specialty businesses along Broadway, Clark Street, and the Argyle commercial strip use BI to analyze inventory performance, customer patterns, channel profitability, and marketing ROI across storefront, e-commerce, and wholesale operations.
Hospitality operations including boutique hotels and short-term rental operations serving visitors to Uptown's entertainment venues use BI to understand booking patterns, revenue management, operational costs, and guest experience metrics.
What to Expect Working With Us
1. Data audit and discovery. We spend one to two weeks mapping your data landscape, interviewing your leadership about information needs, and identifying the highest-impact BI opportunities. The output is a prioritized roadmap with expected value for each phase.
2. Architecture design and approval. We design the data warehouse, ETL pipelines, and dashboard framework before building anything. You review and approve the architecture with clear understanding of technology choices, data flow patterns, and security considerations.
3. Phased development with working dashboards. We build in phases that deliver working dashboards at each milestone. Your team sees real value from the first phase while later phases build on the foundation. This incremental approach means you get value before full completion and feedback from early phases sharpens later design.
4. Training, support, and evolution. Every BI implementation includes training for the teams using the dashboards and self-service platforms. Monthly maintenance retainers cover pipeline monitoring, new metric additions, and dashboard refinements as your Uptown business evolves.