How We Build Analytics and Reporting for Pilsen
Every analytics engagement starts with a measurement planning session. We document the specific business questions you need analytics to answer. What are you trying to learn about your customers, your marketing, and your operations? Those questions determine what we measure, how we set up tracking, and what the reporting structure should look like.
GA4 implementation is the foundation for web analytics. We audit your current implementation, fix what is broken, and add event tracking for the actions that matter to your business: form submissions, phone call clicks, reservation button clicks, online order initiations, email list signups. Each of these user actions becomes a measurable data point that goes into your reporting.
Google Tag Manager configuration handles the technical tracking implementation without requiring changes to your website code every time you need a new measurement. We set up tag management so tracking can be updated and extended without developer involvement for each change.
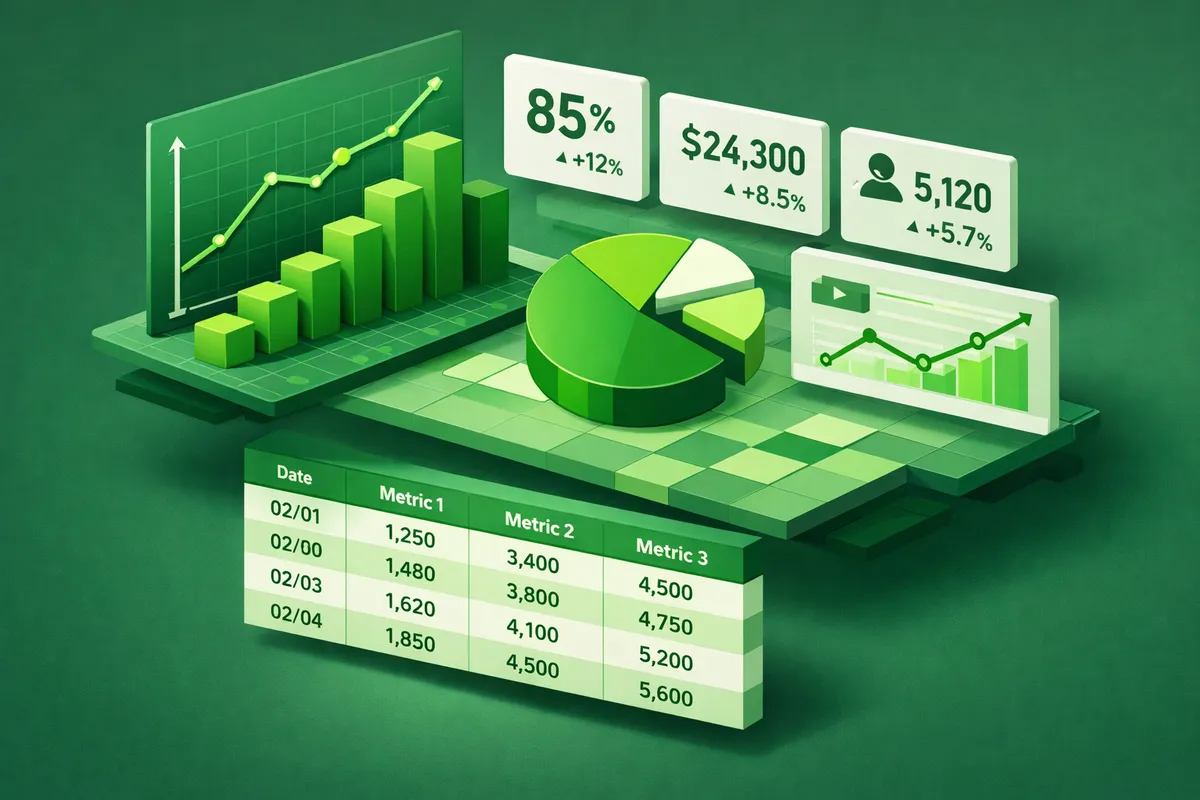
Dashboard development converts raw analytics data into the visual reports that make information usable. We build dashboards in Looker Studio or your preferred reporting platform that display your most important metrics at the level of granularity you need, updated automatically without manual export and formatting.
Data connection brings together information from multiple sources. GA4 web data, Google Search Console organic search data, Google Business Profile performance data, and your email platform's campaign data can all flow into unified reporting that shows how each touchpoint contributes to customer acquisition and revenue.
Automated reporting delivers the metrics you need without requiring you to log into dashboards. A weekly email summary of your most important numbers, delivered every Monday morning, produces more consistent informed decision-making than dashboards that get checked only when something seems wrong.
Industries We Serve in Pilsen
Restaurants and food businesses on 18th Street use analytics to understand which marketing channels drive table reservations and online orders, which menu items are most viewed and ordered through online platforms, and which days and times show traffic patterns that inform staffing decisions.
Galleries and cultural organizations in the Chicago Arts District use analytics to measure exhibition promotion effectiveness, track collector engagement through email campaigns, and understand which digital channels bring buyers versus casual visitors to opening events.
Service businesses across Pilsen use analytics to measure lead source performance, track conversion rates through the inquiry-to-booking pipeline, and understand which services generate the most revenue per marketing dollar invested.
Community organizations use analytics to measure outreach effectiveness, track program registration conversion rates, and produce the data-backed program impact reporting that funders increasingly require.
E-commerce businesses in Pilsen use analytics to understand conversion funnel performance, identify where shoppers abandon the purchase process, and optimize the customer journey from discovery to completed purchase.
What to Expect Working With Us
Measurement planning. We document your business questions and design the measurement framework that will answer them.
Implementation. We configure GA4, Tag Manager, and any additional tracking platforms your business requires. We test every data point before calling the implementation complete.
Dashboard and reporting build. We create the visual reports and automated delivery schedules that put your data in front of you in a format you can use.
Training. We train you on interpreting the reports and taking action based on what you see, not just on reading the numbers.
Ongoing support. We provide support for questions as your analytics needs evolve and make updates when your business or your marketing channels change in ways that require measurement adjustments.