How We Build Analytics and Reporting for Old Town
The first step is a data inventory. We identify every place your business generates structured data: your POS system, your reservation platform, your website analytics, your social media accounts, your email marketing platform, your Google Business profile, and any advertising accounts you run. For an Old Town restaurant, that might be Toast, OpenTable, Google Analytics, Instagram, and a Mailchimp account. Each one holds a different piece of the picture. Our job is to connect them.
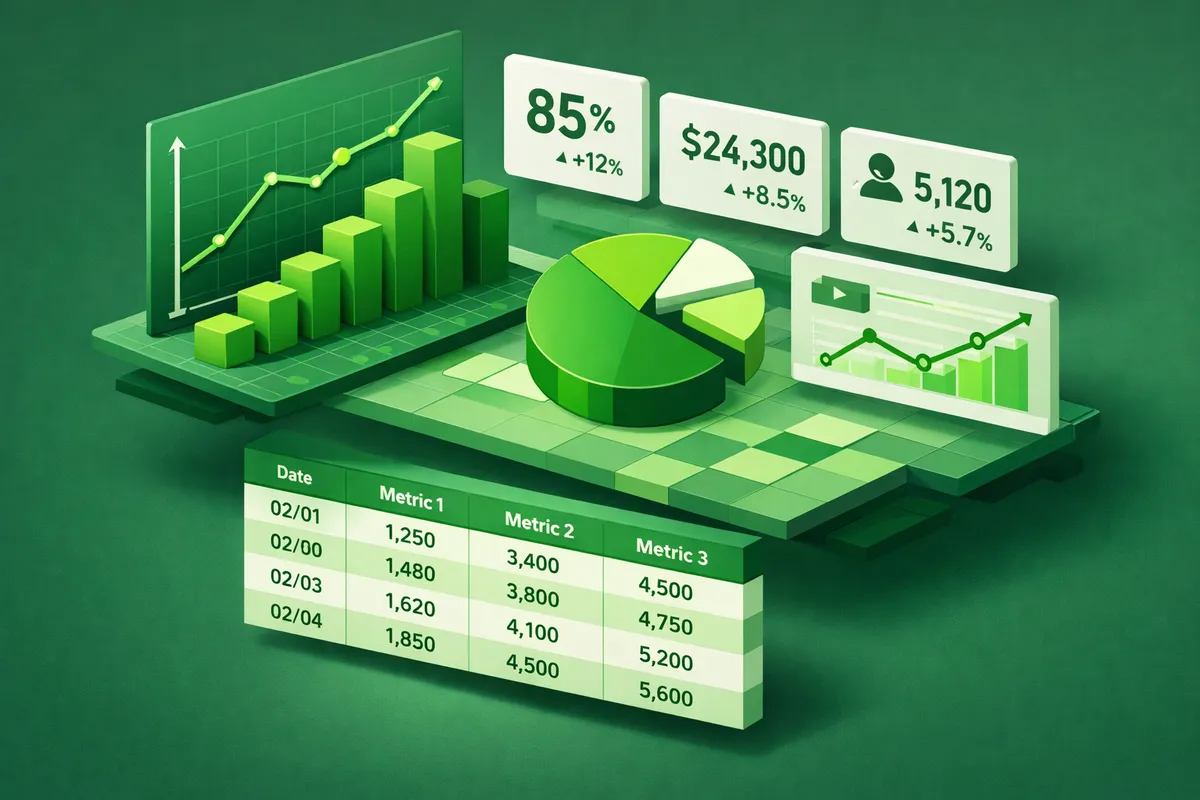
We build a central reporting dashboard that pulls from every connected source and updates on your schedule. A daily operations view shows covers, revenue, average check, and table turn time compared to the same day last week and last year. A marketing view shows which channels drove reservations, what the cost per acquisition was across paid versus organic versus email, and how those metrics have trended over the past 90 days. The dashboard is yours: we build it to match how you think about your business, not how a software template assumes you think about it.
For businesses near the Old Town Triangle or along Sedgwick Street where foot traffic patterns are specific and local, we layer in geo-data and walk-in attribution where available. The goal is not to give you more numbers. It is to give you three or four indicators you check every week that tell you whether the business is moving in the right direction, and one alert that fires when something unusual happens.
Industries We Serve in Old Town
Comedy clubs and live performance venues along Wells Street track more than ticket revenue. Advance ticket sales versus walk-up ratio, bar revenue per show type, repeat audience percentage, and show-level cancellation rates all feed into programming and staffing decisions. Analytics reporting surfaces those patterns across a season instead of requiring a manager to pull individual show reports manually.
Interior design studios and home furnishing showrooms on Sedgwick Street and the surrounding residential blocks drive revenue through a long sales cycle. Analytics reporting tracks where prospects first enter the pipeline, what content or referral source brought them, how long the typical project evaluation takes, and at what stage most prospects convert or go quiet. That data shapes follow-up strategy and helps owners identify which marketing activities produce actual clients.
Boutique retailers on Wells Street compete with online channels that have infinite shelf space and aggressive pricing. Analytics reporting shows which products drive the most foot traffic versus which drive the most margin, which promotional periods produce net-positive outcomes, and how in-store conversion rates compare to website traffic patterns. Those insights shape buying decisions for the next season.
Medical and dental practices near LaSalle Drive track patient acquisition cost, appointment completion rates, recall campaign effectiveness, and insurance versus self-pay revenue mix. Reporting dashboards built for healthcare practices translate those metrics into actionable monthly summaries for practice owners who are not data analysts.
Restaurants and bars between North Avenue and Eugenie Street run on a combination of reservation data, walk-in flow, and delivery channel performance. A unified analytics view shows how those channels interact: whether a promotion on OpenTable cannibalizes walk-in covers, whether delivery revenue grows during weather events, and whether late-night bar traffic correlates with earlier dinner reservations.
Real estate offices in Old Town, where Sedgwick Street and LaSalle Drive address commands a price premium, use analytics to track lead source quality, days-to-close by property type, and agent performance relative to market benchmarks. Reporting that makes those comparisons automatic and current gives brokers and managers the data they need for weekly pipeline reviews.
What to Expect Working With Us
1. Data source audit and connection plan. We inventory every platform generating data in your business and identify which ones are worth connecting. Not every tool produces useful analytics, and we do not build reporting for its own sake. The audit produces a prioritized list of connections ranked by the decisions they will support.
2. Dashboard design and build. We design your reporting views around the decisions you make weekly, monthly, and quarterly. An Old Town entertainment venue needs different views than a medical practice on the same street. We present the design before we build so you can tell us what is missing before we invest time in the wrong direction.
3. Alert configuration. We set up threshold alerts for the metrics that most need monitoring: revenue below a daily floor, reservation cancellations above a threshold, a week-over-week drop in web traffic. Alerts fire when something crosses your defined threshold so you are not checking dashboards hoping to notice problems.
4. Reporting rhythm and review cadence. We set up automated weekly summary emails and monthly performance reports delivered to your inbox. The first month after launch, we review the reports with you to make sure the metrics are landing as expected and adjust any that are not producing useful signal. After that, the system runs on its own and we are available for quarterly deep dives.