How We Build Business Intelligence for Oak Lawn
Business intelligence projects begin with a question inventory. We interview the owner and key managers and ask: what do you wish you knew every morning? What information do you currently spend time assembling that you should be able to see automatically? What decisions do you make on gut feel because the data is too hard to pull together quickly? Those questions define the reporting scope before we connect to a single database.
From the question inventory, we map the data sources. For a medical practice near Advocate Christ Medical Center, that might mean the practice management platform, the billing system, the scheduling tool, and QuickBooks. For a multi-bay auto service center on Harlem Avenue, it might mean the dealer management system, parts inventory, and point-of-sale. We document where the data lives, what format it is in, and what transformations are needed to make it comparable across sources.
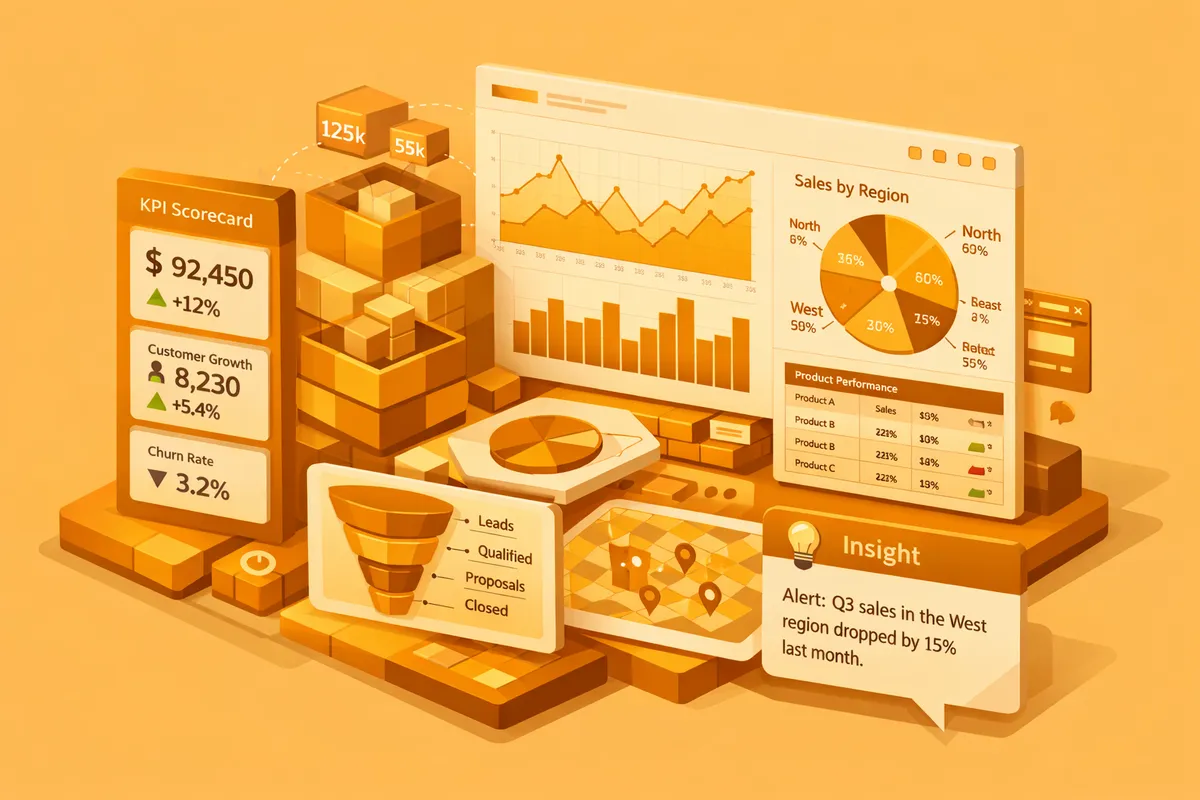
We then build the data infrastructure: connections to each source, transformation logic that normalizes the data, and a delivery layer that puts the right metrics in front of the right people. For Oak Lawn business owners who review numbers on their phone between appointments, that means mobile-optimized dashboards. For office managers who run weekly team reviews, that means automated reports delivered on schedule. The delivery format matches how the business actually consumes information.
Industries We Serve in Oak Lawn
Medical practices and clinical operations near Advocate Christ Medical Center on 95th Street use BI to monitor claim denial rates by payer, track patient retention by provider, measure appointment utilization against available capacity, and compare monthly revenue per encounter across service types. These metrics turn a billing statement into a management tool.
Insurance agencies on Cicero Avenue build BI systems that track premium-in-force growth by product line, renewal rates by segment, new business by referral source, and agent productivity. An agency principal who currently estimates these figures from memory can run the business more precisely with automated dashboards that update daily.
Auto dealers and service centers on Harlem Avenue use BI to track service ticket value by service type, technician utilization, parts inventory turns, and customer return frequency. A service manager with this visibility knows which services to promote during slow periods and which technicians have capacity for additional work on any given day.
Specialty retail businesses near The Fairway Retail Center on 103rd Street track inventory performance metrics: margin by product category, sell-through rates, vendor performance, and seasonal sales patterns. A retailer who knows that a particular category underperforms every January can plan buying and promotions accordingly rather than discovering the pattern after the fact.
Small professional offices throughout Oak Lawn handling accounting, legal, or financial services use BI to track billable hours by client, revenue per engagement type, accounts receivable aging, and staff utilization. These metrics make capacity planning and billing discipline more concrete and actionable.
Family restaurants and catering operations near The Fairway Retail Center use BI to measure table turn rates, average check by daypart, food cost percentage by menu category, and catering revenue as a share of total revenue. These numbers turn a restaurant's intuition about what is working into data-backed decisions about menu, staffing, and marketing.
What to Expect Working With Us
1. Question inventory and data source mapping. We interview the decision-makers in your business to identify the ten to fifteen metrics that would most improve decision-making if they were available automatically. We then document where each metric's underlying data lives and what is needed to surface it.
2. Data infrastructure build. We connect to each data source, build the transformation logic that normalizes and calculates the required metrics, and establish the refresh schedule that keeps the data current. For Oak Lawn businesses with sensitive data in healthcare or financial platforms, we build connections with appropriate security and access controls.
3. Dashboard and report design. We build the dashboards and automated reports that deliver the metrics to the right people in the right format. The design prioritizes clarity over completeness. A dashboard that answers three critical questions at a glance is more valuable than one that displays forty metrics that require ten minutes to interpret.
4. Training and adoption. We train the team members who will use the BI tools and establish a cadence for reviewing the metrics. For most Oak Lawn businesses, this means a weekly review of operational metrics and a monthly review of trend metrics. The habits around reviewing data matter as much as the data itself.