How We Build Analytics and Reporting for Lincoln Square
We start by mapping your data sources. Every system that holds data about your business, your POS, your booking platform, your accounting system, your email tool, your social media accounts, becomes a potential input to the reporting system. We inventory what is available and what is actually useful versus what is technically accessible but not relevant to how you run the business.
We then define the key performance indicators that matter for your specific business model. A Lincoln Square restaurant's KPIs are different from a music school's KPIs. Revenue per seat and table turn time matter for the restaurant. Enrollment conversion rate and family retention rate matter for the music school. We identify the ten to fifteen metrics that most directly govern the health and trajectory of your specific business and build the reporting system around those.
We connect the data sources, build the ETL pipelines that move data from each source into a unified reporting layer, and build the visualizations that make the metrics legible. We use dashboarding tools appropriate to the scale and technical complexity of your business: for most Lincoln Square small businesses, a well-configured Google Looker Studio or Metabase dashboard covers the need without the cost and complexity of enterprise BI tools.
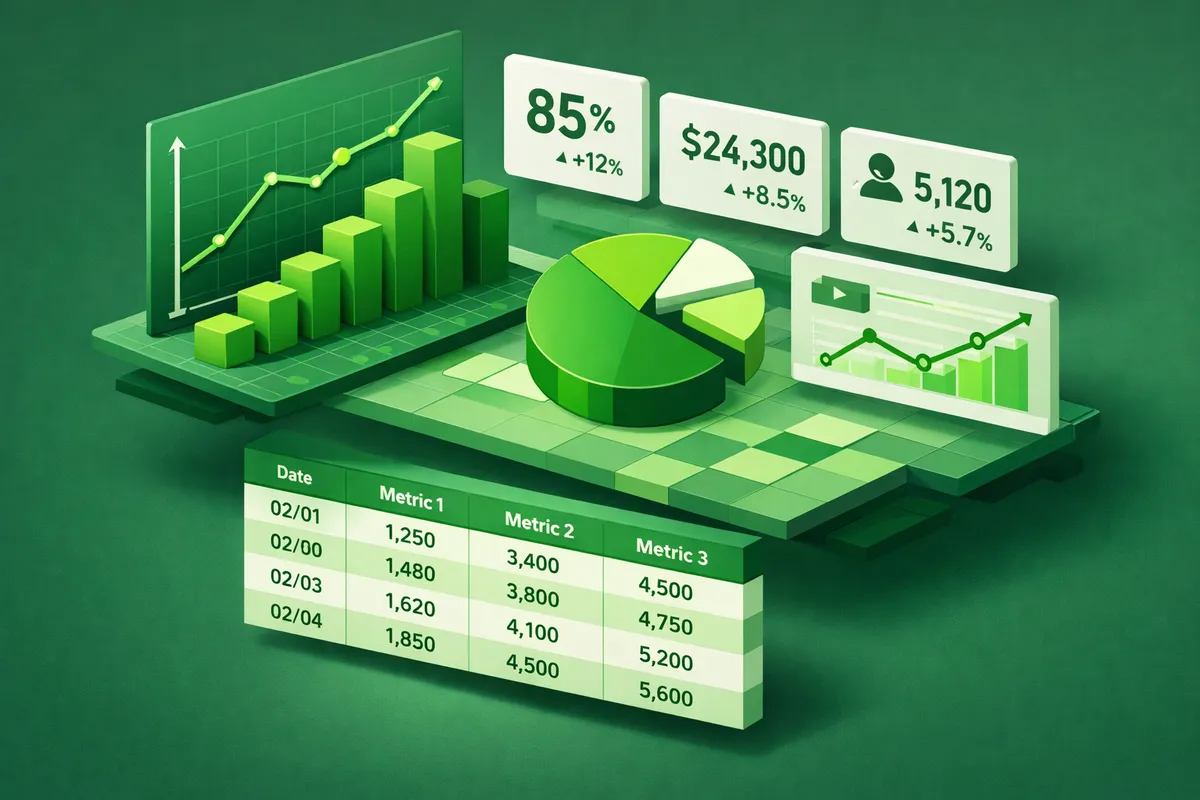
We deliver dashboards that are built for the owner or operator who needs to understand the business quickly. Clear labels, consistent color coding, trend lines that show direction rather than just point-in-time values, and alerts when key metrics fall outside expected ranges.
Industries We Serve in Lincoln Square
Independent restaurants and cafes on Lincoln Avenue and Lawrence Avenue use analytics dashboards to track daily and weekly revenue by daypart and day of week, monitor food cost percentage against revenue, compare catering versus dine-in performance, and identify the menu items and table configurations that produce the best margin per service.
Music schools and arts education businesses near the Old Town School of Folk Music track enrollment by instrument and age group, monitor semester-to-semester retention rates by family, identify the lead sources that convert to enrolled students at the highest rate, and measure instructor utilization against revenue per instructor.
Fitness and wellness studios on Western Avenue and throughout the neighborhood track membership count and churn rate, class attendance by format and instructor, revenue per member per month, and the class visit frequency patterns that correlate with long-term retention versus early cancellation.
Boutique retail shops along Lincoln Avenue and near Giddings Plaza track revenue per transaction, inventory turn rate by product category, seasonal demand patterns that inform buying decisions, and the customer segments that produce the highest lifetime value.
Specialty service businesses operating from Damen Avenue into Ravenswood track project revenue by client and service type, measure billable utilization against capacity, monitor accounts receivable aging, and compare the profitability of different service lines to inform pricing and resource allocation decisions.
Event and cultural businesses near Welles Park track ticket revenue and attendance by event type, measure the marketing channel attribution for ticket sales, compare revenue per event against cost per event to identify the event formats that produce the best economics, and monitor the audience retention patterns that determine how many past attendees return for future events.
What to Expect Working With Us
1. Data audit and KPI definition. We map your current data sources, identify which systems hold usable data, and work with you to define the specific KPIs that govern your business decisions. We produce a reporting requirements document that becomes the specification for dashboard design.
2. Data connection and pipeline setup. We connect each of your data sources to the reporting layer, configure the extraction and transformation rules that produce clean, consistent data, and validate that the numbers in the dashboard match the numbers in the source systems. Data quality comes before visualization.
3. Dashboard design and delivery. We build the dashboards to the specifications defined in phase one. We present the initial designs for your review and adjust based on your feedback before finalizing. We prioritize clarity and daily usability over visual complexity.
4. Training and ongoing support. We train you and any team members who will use the dashboards regularly. We establish the alert rules that notify you when key metrics fall outside acceptable ranges. We provide sixty days of support after delivery to address questions and make refinements based on how you actually use the system.