How We Build Analytics and Reporting for Hyde Park
We start every engagement with a reporting inventory. What reports does the organization produce, how often, for whom, and with what inputs. This inventory almost always reveals that the organization is producing too many reports of inconsistent quality, and that some of the reports could be consolidated or eliminated entirely. The first deliverable is a clean map of what reporting should actually look like, before we build anything technical.
From there, we identify the data sources each report draws from. For a Hyde Park nonprofit, this is usually a mix of donor database, fund accounting system, program management tools, and manual spreadsheets. For a medical practice near UChicago Medicine, it is the EMR, the practice management system, and sometimes external survey data. For a retailer on 53rd Street, it is point of sale, ecommerce platform, and accounting software. We build connections between the tools and a central reporting layer so data flows automatically rather than being manually copied between systems.
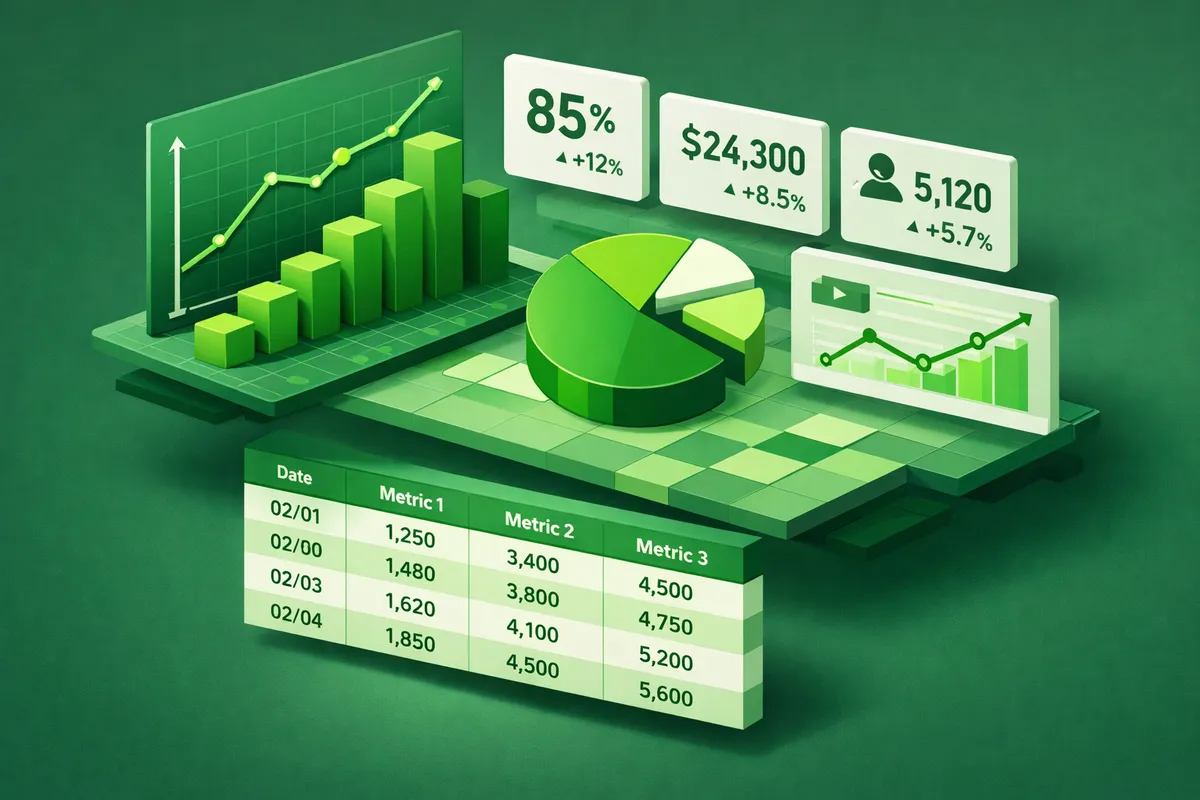
The reporting layer itself is a set of dashboards and repeatable report templates. For most Hyde Park clients, we use tools that are lightweight, cost-effective, and do not require the organization to hire a data analyst to operate. A nonprofit development officer should be able to pull a donor report on demand without asking anyone for technical help. A medical practice manager should be able to see daily, weekly, and monthly operational dashboards without running SQL queries. The tools we choose for a small organization are intentionally different from what a Fortune 500 company would use, because the operating reality is different.
We also build the automation that produces recurring reports on a schedule. A monthly board report that currently takes twelve hours to produce manually should be generated automatically, needing only narrative review before distribution. A quarterly grant report that currently takes twenty hours should draw its data from the reporting system automatically and need only narrative framing. This is where the time savings are realized. The transition from manual to automated recurring reports is usually the moment Hyde Park clients see the full value of the engagement.
Training and handoff are essential. We do not want to become the permanent reporting team for our Hyde Park clients. We want the organization to own and operate its reporting practice after we have built it. Every engagement includes training for the staff who will run reports, documentation for the systems we build, and a period of post-launch support to make sure the practice becomes stable.
Industries We Serve in Hyde Park
Nonprofits and cultural institutions near the Hyde Park Art Center, the DuSable Museum, the Experimental Station, and Jackson Park use our services for grant reporting, donor reporting, board reporting, and program outcome measurement. The system is tuned to the reporting rhythm of a nonprofit with active grant portfolio.
Medical practices and clinical operations near UChicago Medicine and throughout Hyde Park use our services for operational dashboards, clinical quality reporting, insurance performance reporting, and practice financial reporting. All reporting handles the HIPAA and compliance considerations clinical environments require.
Law firms and professional services practices on Lake Park Avenue, 53rd Street, and Cornell Drive use our services for case performance reporting, client billing and utilization reports, business development reports, and partnership dashboards. Small firms get reporting capability usually reserved for much larger firms.
Small businesses and retailers along 53rd Street, 57th Street, and Harper Court use our services for sales reporting, inventory reporting, marketing performance dashboards, and financial reporting to lenders and partners. Operators get clear views of their business without the manual reconciliation burden.
Academic and research-affiliated operations connected to the University of Chicago community, including small research groups, think tanks, and policy shops, use our services for program reporting, funder reporting, and publication and impact dashboards.
Community organizations throughout Hyde Park use our services for member reporting, program participation tracking, and annual reporting to their boards and funders.
What to Expect Working With Us
1. Reporting inventory and strategy. We map what you currently report, who the audiences are, and what should actually be reported going forward. This phase usually produces a written plan within two weeks of engagement start.
2. Data source integration. We connect the tools your data lives in, build the central reporting layer, and validate the data flows. This phase runs three to six weeks depending on the number of sources.
3. Report templates and dashboards. We build the specific reports, dashboards, and automation. Each report is reviewed with you before it goes live.
4. Training and handoff. We train your staff, document the system, and stay engaged for thirty to sixty days post-launch. After that, your team operates the reporting practice with light ongoing support from us as needed.