How We Build Business Intelligence for Andersonville
We start by understanding the specific decisions you make most frequently and what information those decisions require. A wine bar operator making weekly wine buying decisions needs different BI than a yoga studio manager making scheduling decisions. The interview process surfaces the actual decision workflows before any technical work begins.
Data connections to your existing software are built as automated pipelines that update daily without manual intervention. Your POS, booking platform, e-commerce store, and marketing tools each contribute their piece of the picture. We connect sources that exist in your current environment without requiring you to change software or add new tools to make BI work.
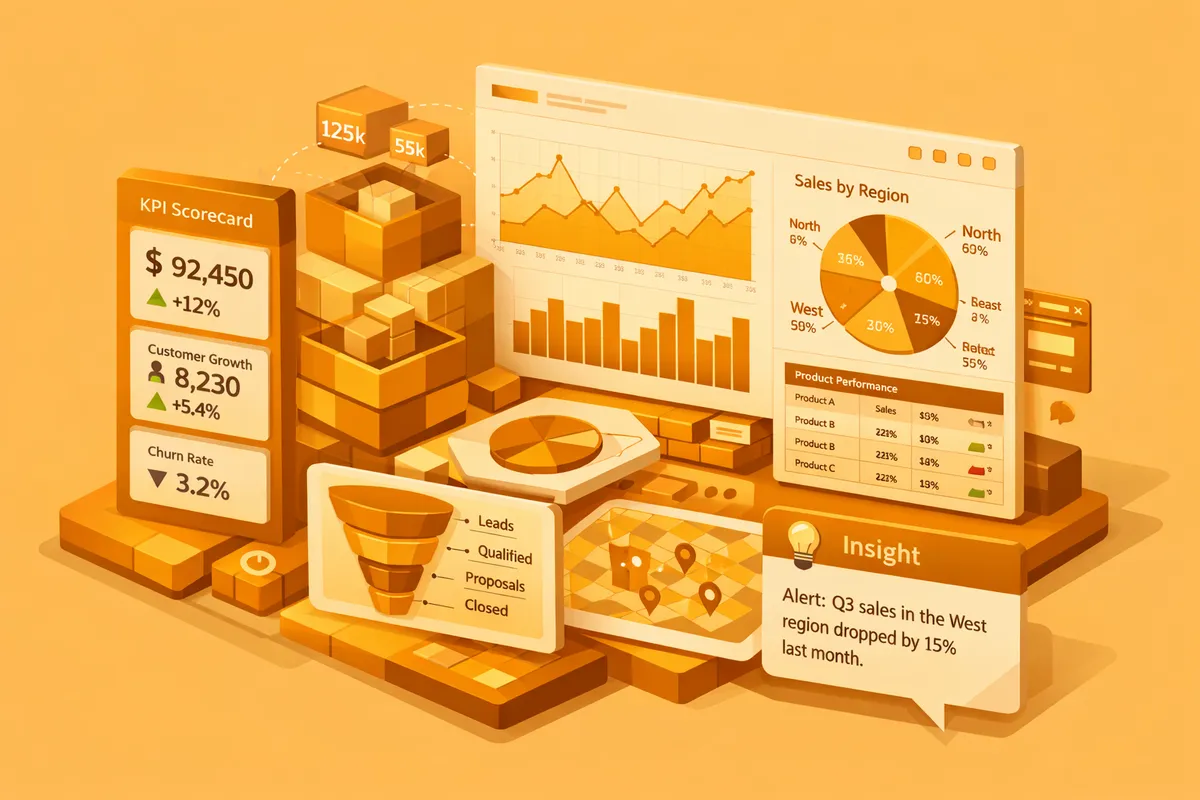
Dashboard design follows the principle that a busy Andersonville business owner should be able to glance at their dashboard for sixty seconds and know what they need to know. Charts that require explanation to interpret get redesigned. Metrics that do not connect to a specific decision get removed. The standard is actionability, not completeness.
Industries We Serve in Andersonville
Independent restaurants and bars on Clark Street need BI that surfaces menu performance, covers per shift, revenue per server, and the specific occasion patterns that drive their highest-revenue periods. A wine bar tracking its Friday evening tasting event attendance alongside standard table service revenue can measure whether the event program is cannibalizing or additive. A restaurant near Hopleaf Bar can benchmark its own Monday-to-Friday revenue distribution against its own historical patterns to identify whether the shoulder periods are improving or declining. These are the insights that inform menu, staffing, and promotion decisions.
Specialty retailers between Foster and Bryn Mawr need product performance data that identifies which categories are driving revenue per square foot, which items have been on the floor too long, and which customer segments are driving the most repeat visits. A Clark Street home goods shop can see whether its Scandinavian-import category is growing or declining as a share of total revenue, informing buying decisions for the next purchasing trip to Scandinavia. Category-level performance data turns seasonal buying from instinct into evidence.
Wellness studios and fitness businesses near Bryn Mawr Avenue need class performance data: which formats fill consistently, which times attract the most loyal clients, which instructors have the strongest client retention rates. A yoga studio offering twelve class formats can see which four are filling at 85 percent or better and which four are regularly running at 40 percent, allowing the studio to reallocate scheduling time to what the community actually wants rather than what the owner thinks it should want.
Queer-owned and community-oriented businesses in Andersonville's distinctive commercial district often serve customer communities whose patterns differ from citywide averages. BI built for the specific customer base, identifying the peak days, the high-value customer segments, and the retention patterns that characterize Andersonville's loyal independent-business community, gives these businesses insights that generic industry benchmarks cannot provide.
Professional services firms on Ashland Avenue need BI that surfaces utilization rates, client profitability, and pipeline health in a format that supports the specific management decisions that professional services firms make. Which service lines are growing? Which clients are consuming more than their billing justifies? Which practitioners are at capacity and which have room to take new clients? These questions have concrete financial consequences, and BI that answers them automatically saves the management time that manually assembling the same analysis would require.
Specialty food producers and wholesale businesses serving the Andersonville market need BI that tracks channel profitability across retail, wholesale, and e-commerce simultaneously. A specialty food producer selling through farmers markets, restaurant wholesale accounts, and an e-commerce store needs to see gross margin by channel, not just total revenue, to make intelligent decisions about where to invest in growth. BI that calculates and displays channel-level margin automatically turns a weekly reconciliation project into a real-time management tool.
What to Expect Working With Us
1. Data audit and decision mapping: We catalog the data your business generates, where it lives, and what decisions it should inform. Most Andersonville businesses are surprised by how much usable data already exists in their current software waiting to be organized and surfaced.
2. Dashboard design: We interview you about the decisions you make most frequently and design dashboards around the information those decisions require. Every dashboard is specific to your Andersonville business, not a generic template with your logo added.
3. Implementation: We build the data connections, configure the reporting, and set up automated delivery that gets information to you without requiring you to seek it out. Weekly summaries arrive in email. Anomalies trigger alerts.
4. Refinement: After several weeks of using the dashboards, you will have better ideas about what is most useful. We build in a refinement period to make the system fit your actual decision-making process rather than the process we imagined during design.